Synopsis
Every business starts with cash, which is invested in numerous ways to generate revenue. Ultimately, the revenue is turned back into cash, and the cycle begins anew. Through each step in the business, cash cycle financial data is created that, when recorded, can be used to report on the results of operations. If the data is accurately recorded, you will know with confidence the company's financial position for any given period. Use this information to manage your business to higher profits.
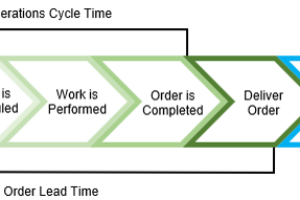
Every business starts with cash, which is invested in numerous ways to generate revenue. Ultimately, any revenue is turned back into cash, and the cycle begins anew.

The above business cash cycle produces financial data that, when recorded, can be used to report on the results of operations. If the data is accurately recorded, you will know with confidence the company’s financial position for any given period. The following table summarizes the logic behind the three primary financial statements used by all successful business owners:
| Income (P&L) Statement | Balance Sheet | Statement of Cashflows |
| Sales – Expenses = Net Income | Assets = Liabilities + Owners Equity | Operating + Investing + Financing Cash |
| 1. A summary of management’s performance is reflected in the business’s profitability (or lack of it) over a specified period. P&L itemizes revenues and expenses of the past that led to the current profit or loss and can be used to identify what may be done to improve future profits.
2. Net income is the owners’ return from operations and represents either an increase or decrease in the value of their investment in the business. 3. In contrast to a balance sheet, an income statement depicts what happened over a month, quarter, or year. |
1. Listing at any point in time of a company’s measurable assets (the capacity to produce revenue), liabilities (borrowings), and equity (owners’ investment or the claim the owner has against the assets.)
2. States (1) what assets the company owns, (2) what it owes (its liabilities), and (3) what amount is left to the owners after satisfying the liabilities. 3. Owners’ equity is not the owner’s piggy bank; it represents the owners’ claim on the company assets leftover AFTER the liabilities have all been paid off. |
1. It provides a comprehensive picture of the company’s cash flows beyond operations to see how cash changes from the beginning to the end of a period.
2. A summary of the actual or anticipated incomings and outgoings of cash over an accounting period (month, quarter, year). It answers the questions: Where the money came or will come from and where the money went or will go? 3. Operating cash flow can justify making new investments in the business, repaying financial debt, or returning capital to the owners. |
Four additional considerations associated with financial statements and their uses:
- How often should I review my financial statements?
- Use a year-over-year comparison of your financial statements to make their review easier.
- Use an actual-to-plan comparison variance report to gauge how well you are performing to expectations.
- What should I look at each month on my Balance Sheet?
1. How often should I review my financial statements?
Any review of your financial statements is driven by the speed at which your financial statement data is changing. For most businesses, a monthly review works well. Your goal is to examine your financial statements in a disciplined way each month. Ideally, they’re reviewed during the second management meeting of the month, along with the monthly KPI dashboard.
Every month, plan to generate the following financial reports from your accounting software:
- Monthly P&L Statement reporting current versus the same previous
- Monthly “Variance to Plan” report comparing actual versus profit plan.
- Month-end Balance Sheet.
One of the benefits of doing the monthly is you get a better appreciation if the relationship of your P&L Statement to your Balance Sheet. The P&L Statement shows you the detail of why Retained Earnings an important Equity account on your Balance Sheet changed based on the Net Income results of your P&L Statement.
2. Use a year-over-year comparison of your financial statements to make their review easier.
Your first variance assessment should involve your monthly profit and loss statement comparison of current results versus the result for the same previous period. Make sure that the results reported for the current year are relatively consistent with the same period in the previous year. Or be very clear on the reason(s) they might differ. If the difference is significant and can’t be readily explained, you likely have a data entry error. Again, significant variances by major sources of revenue and expense should be relatively easy to explain based on observed changes in the business this year compared to last year.
If you can’t explain the variance in results for this year versus the previous year, you have discovered another area where corrective action must be taken. Again, any corrective action involves identifying what is to be done, who is responsible for accomplishing it, and when it needs to be completed. Follow-Through on each assigned corrective action is essential to avoid falling short of your profit goals.
The following are the three key points to remember in your assessment of the “actual versus same previous period” P&L report:
- Did the actual COGS percent of revenue remain consistent? or
- Did the COGS percent of sales go higher or lower for the given review period compared to the previous period?
- If the percent changes aren’t consistent with your changes in sales, then your COGS expenses aren’t as variable as they need to be.
3. Use an actual-to-plan variance report to gauge how well you are performing to expectations.
Your second variance report helps ensure that your business is on track to achieve your planned profits—the same goals you established during Step 2—Build Your Twenty-Four-Month Profit Plan. Here, you’ll confirm your actual performance against your planned performance by month and year-to-date. A positive variance indicates that your actual performance is exceeding planned. An unfavorable variance tells you where you are falling short relative to your profit plan targets.
Any negative actual-to-plan variance will cause you to miss that planned amount unless a corresponding positive variance in another area can correct for the miss. You can avoid these misses by identifying what corrective action needs to be taken, who is responsible for accomplishing it, and when it needs to be completed. Timely follow-through on each assigned corrective action is the best way to avoid falling short of your profit plan goals.
It’s important to remember the following two critical components in the “Variance to Plan” report:
The “Percent of Budget” is a calculation that reflects the degree to which the actual result met the budgeted expectation. Any number greater than 100 percent indicates that the actual was higher than planned. This is a good variance to have; for Overhead, this is a lousy variance. Consider the following core questions:
-
-
- Did the budgeted Gross Profit percent come in as expected, regardless of the actual revenue dollars for the given review period?
- Did the budgeted Operating Income percent come in as expected, regardless of the actual revenue dollars for the given review period?
-
Keep these basic tenets in mind during your monthly variance review process, which should run similar to the following:
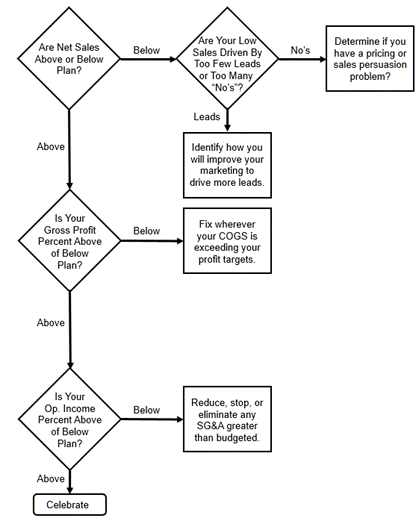
There are principally only two ways to increase sales—increase the volume (number of sales) or increase the value (price) of the sales. A minor variance-to-plan is to be expected; however, one should be mindful of trends. If trending below plan, you must boost sales revenue as needed, given how quickly money is lost anytime sales fail to cover expenses.
While minor variances in COGS are to be expected, significant differences as a percent of sales to plan indicate that your direct costs are not variable. This must be corrected or you will have insufficient Gross Profit contribution to cover your overhead and leave a profit for you.
Overhead should essentially be equal to plan if all items are categorized correctly. The only exception would be months with planned variances such as an extra pay period or when an insurance policy premium is paid over nine months to ensure a full year’s coverage.
What should I look at each month on my Balance Sheet?
Your balance sheet changes each month, yet it doesn’t change significantly like your P&L Statement unless you make a significant asset purchase financed through debt or equity. Just the same, you’ll want to check the following each month:
- Accounts Receivable: This should be growing but not faster than the business in general. Many businesses get in trouble because they do not collect, on a timely basis, the monies owed to them.
- Accounts Payable: This should not be growing at a rate faster than business growth in general. If it is, then you are borrowing from your vendors. This practice is not necessarily bad, but it is not sustainable over the long term. Anytime A/P grows faster than gross profit, you have a severe problem that needs to be fixed quickly.
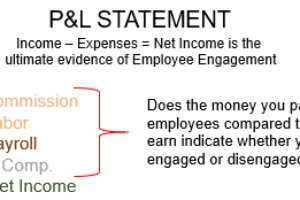
To WIN in the game of business, you need both positive operating cash flows (B-CPR Step 1) and healthy net profit (B-CPR Step 2) to remain a viable business. This is because cash is allocated to employees as wages to suppliers as accounts payables, to lenders as interest, and to the government as taxes with whatever being leftover forming profits to give to investors as cash dividends or to reinvest back into the company.
Positive cash flow and profitability are achieved through thoughtful planning, disciplined work, and accurate plus timely reporting of the results. This is how you know if the results of your never-ending hard work and sacrifice are worth the effort.
Do you struggle using your financial statements?
If you struggle with timely and accurate recording of your business transactions, click the link below to see how at risk your business is to fail in the next three years because you don’t consistently record your business transactions in your accounting software.
Upon completing the business fitness test, you will receive a risk profile showing how at risk your business is to suffer cash flow and profit problems, the primary cause of business cardiac arrest over the next three years.
Do you struggle using your financial statements?
If you struggle with timely and accurate recording of your business transactions, click the link below to see how at risk your business is to fail in the next three years because you don’t consistently record your business transactions in your accounting software.Upon completing the business fitness test, you will receive a risk profile showing how at risk your business is to suffer cash flow and profit problems, the primary cause of business cardiac arrest over the next three years.
TAKE THE TEST