Synopsis
The “black or white” power of business math lies in how it helps you develop more control over your business. The results of your profit calculations enable you to know with 100% certainty whether what you planned for happened or not. There are no shades of gray to distract you when you know the profit math of business.
The financial reports used by your accountant to calculate your financial position for tax liability purposes is the roll-up of each completed business transaction recorded in your accounting software. The good news is these same financial reports can be used for so much more than positioning your accountant to prepare your tax return. All you need to make better use of your financial statements to generate higher operating cash flows and profits is to understand how business profitability is calculated and a handful of business profitability ratios.
By learning how to do the profit math of business, you develop more control over your business by applying the “black or white” power of business math to your decision-making. The results of your profit calculations are clear and definite; either what you calculated happened or no, it didn’t. There are no shades of gray to distract you.
When you work with your business numbers, you better see what you need to start, change, and stop. Knowing what goes into calculating your business profitability tells you where your business is in and out of control. Failing to apply the profit math of business makes it difficult to know what areas in your business are not performing as you need them to.
Business decisions are easier when you eliminate the shades of gray caused by too many assumptions.
Failing to do the math of business compromises your ability to decisively decide what to do differently because you are much more likely to see shades of gray (fuzzy and unclear) than you do black or white. It is hard to be confident in taking on a new action or stopping an old one when what you see is the following in an area of concern:

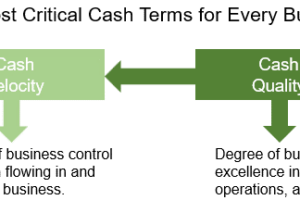
BusinessCPR™ (B-CPR) helps you see your business through the business profit calculations and ratios that enable you to confirm if what you planned to have happened did or not.

The other benefit of knowing the profit math of business is that you will work fewer hours to achieve your desired results. You spend less time in your business because you are more focused each day on those “critical few” actions that need to be accomplished. Use this website to see just how easy it is to do the profitability math of business. Click here to start populating the associated values from your most recent year-end P&L Statement in the shaded boxes below to access the business profitability calculator and ratios offered on business-cpr.com:
Click here to access the BusinessCPR™ Profit Math Calculations worksheet for your immediate use. Use the shaded cells in the first part of this worksheet to record the P&L Statement results for your business from last year’s ending P&L Statement to help you establish the profit targets you want to achieve this year.
In the next section of the Profit Math worksheet you will see how your Net Sales converted into Gross Profit, Operating, and Net Income. The previous year results will transfer directly into the following section with the shaded cells providing you the opportunity to record your plan year profit targets to establish the profit gap you have to close as a percent of Net Sales.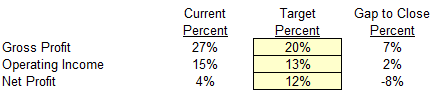 The “Gap to Close Percent” column of results represents the difference between your current profit percentages and your targets for the plan year. Below are the actual versus target business profit equation values at the same Net Sales used in this example:
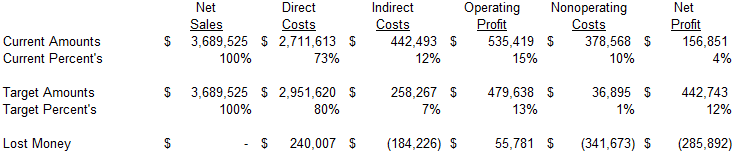 The last row of results shows the money that is lost by a business that fails to hit its planned profit targets. Use the BusinessCPR™ Profit Math Calculations worksheet to quickly get these same calculations performed for your business.
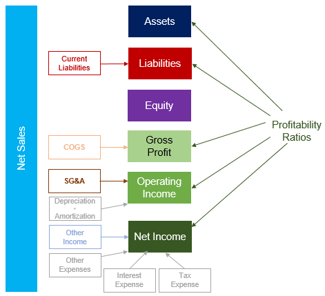
Appreciating the P&L Statement through its four core components
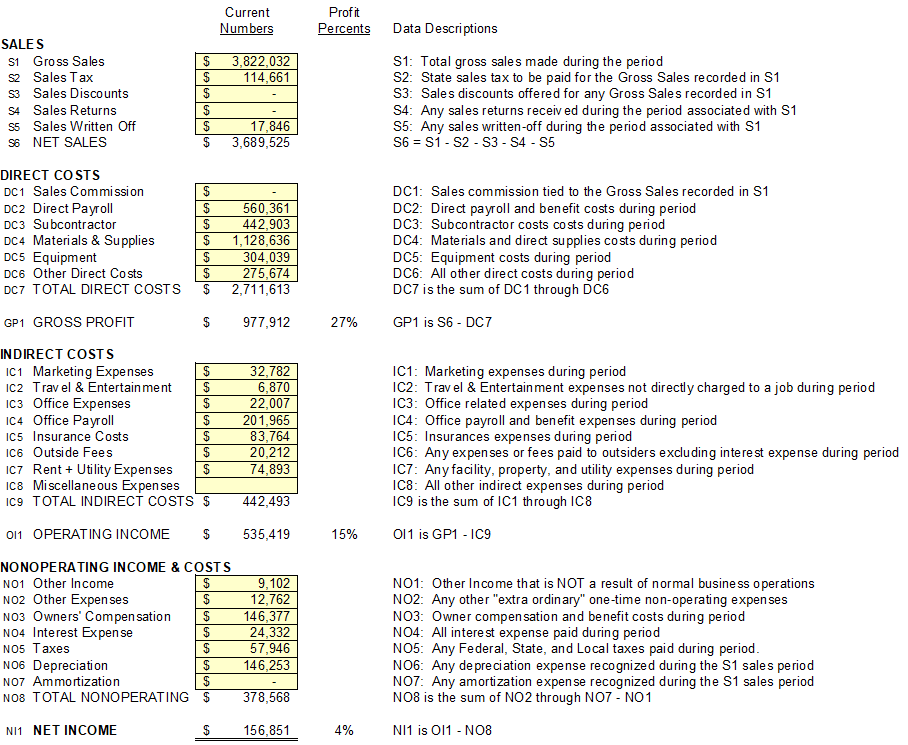
Included within the BusinessCPR™ Profit Math Calculations worksheet are examples of two businesses to those wanting to master the math of business. As you see below, Business A generated over $3.8 million in Gross Sales but netted $3.7 million in Net Sales after sales tax and bad debt are factored in.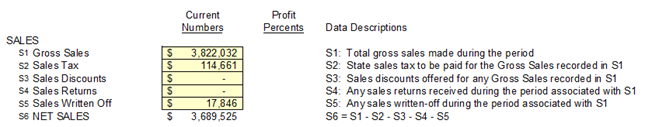 The challenge for this business is they payout 73% of what they bring in from Net Sales in direct costs resulting in only a 27% Gross Profit Margin. As you review the numbers below, you see that their best opportunity to make more money is to see what they can do differently to lower their materials costs as a percent of sales.
 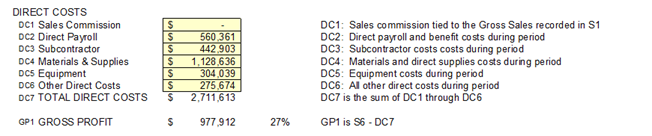 The good news for this business is they keep their indirect costs manageable, so they are still earning a 15% Operating Income Margin even though their Gross Profit Margin is below 30%.
 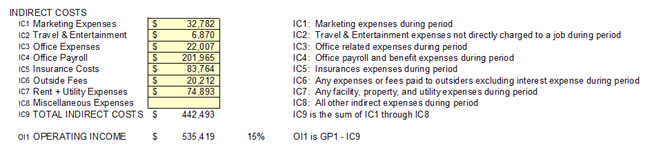 The better news in this business is the owner made 4% of Net Income after paying themselves 4% in owners’ compensation. This is a business owner who is doing several things right in their business.
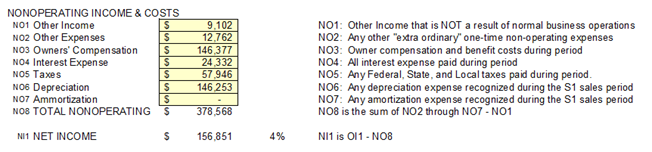 The biggest challenge with this business is how sensitive they are to changes in sales volume. Reduce Gross Sales by 10% from $3.8MM to $3.4MM, and you swing from a 4% profit to a 6% loss by reducing sales. The point of this comparison is you don’t need an MBA to work the math available to you from your P&L Statement to confirm that this business is highly sensitive to changes in sales.
Financial ratios are agnostic relative to the size of a company or the type of industry.
Financial ratios are mathematical comparisons of financial statement accounts used to understand how well a business is performing and where, exactly, it needs to improve. Each ratio is simply a raw computation of financial position and performance used to identify a company’s strengths and weaknesses.
Below are the most common profitability ratios used to confirm a company’s ability to generate profits from its operations. Profitability ratios are used to judge how well a company can achieve profits from its operations by verifying how well it uses its resources and assets to generate profits. They primarily relate to efficiency ratios because they show how well the company uses its assets to generate profits.
The profitability of your business is essential to your continued business success. Below are the most meaningful profitability ratios auto-calculated within the BusinessCPR™ Profit Math Calculations worksheet from the information you enter from your P&L Statement. Below is the results of these calculations for Business A:
Gross Margin Ratio
Gross margin represents the percentage of pure profit from the sale that can go to paying operating expenses after removing the cost of goods sold. A falling gross income shows that production costs are rising faster than the selling price or that inventory is shrinking due to fraudulent activity or product spoilage.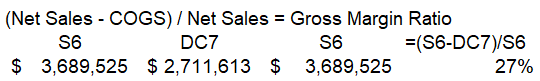 A 40% gross margin means that for every dollar of sales, 40 cents remains from that sales dollar after the cost of goods sold is paid to cover the non-operating or fixed expenses before a profit is realized. There are two ways to achieve a higher Gross Margin ratio:
- Reduce costs by buying materials or labor at a lower price
- Sell your products at a higher mark-up.
A high gross income means stability in times of economic downturn because the company can afford to cut prices; a low gross income may mean low creditworthiness and an inability to fight off competition.
Operating Margin Ratio
Operating income is what’s leftover from a dollar of sales after subtracting all of the costs of producing, acquiring, and selling your products and services. It represents what is available from each dollar of sales to pay its capital providers and taxes.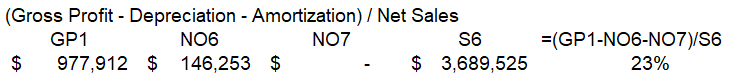 A 20% operating ratio means that for every dollar of income, only 20 cents remains after the non-manufacturing operating or fixed expenses have been paid, or that 20 cents are left over to cover the non-operating expenses before a profit can be realized.
The Operating Margin Ratio is a key indicator for showing how a business funds its operations. And, the best measure of managerial performance is how much revenue is left over after all operating costs have been paid. This number reveals what proportion of revenues is available to cover non-operating costs.
EBITDA Earnings Ratio
The EBITDA Earnings Ratio, as a percent of Net Sales, is the most commonly used indicator of the current operational profitability of a business. As such, it’s often used to set performance standards. A 15% EBITDA earnings ratio means that only 15 cents of operating profit remains to cover interest, taxes, depreciation, and amortization expenses for every dollar of sales. What’s leftover can be paid out as dividends or reinvested into the business.
The EBITDA Earnings Ratio is used to determine the profitability of a business’s operations. It is a more accurate picture of a company’s success than gross sales and a better proxy for cash operating profit.
Net Income Margin Ratio
Net Income Margin Ratio measures how effectively a company can convert sales into net income. Also called return on sales ratio, it validates a company’s pricing policies and cost controls. Indirectly, Net Income Margin Ratio measures how well a company manages its expenses relative to its net sales by showing what percentage of sales are left over after all expenses are paid. A 10% net income or profit margin ratio means that for every dollar of sales, only 10 cents remains as profit to be paid out as dividends or reinvested into the business.
A business can achieve higher ratios by generating more revenues while keeping expenses constant or keeping revenues constant and lowering expenses. A low-profit margin indicates high risk, with the possibility that a decline in sales will erase profits and result in loss.
Note: the next three calculations require the use of both the P&L Statement and the corresponding Balance Sheet to complete. If you are using the BusinessCPR™ Profit Math Calculations worksheet, you will use the yellow shaded cells to record your corresponding Balance Sheet values.
Return on Asset Ratio (ROA)
ROA measures how efficiently a company can manage its capital assets to produce profits during a given period. The return is measured in “profits earned” from all of the company’s assets, regardless of whether they were funded with debt or equity—whereas ROE (see below) is focused only on the owner’s investment (equity).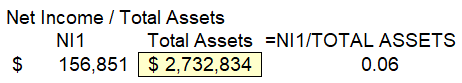 A ratio of 1 means that a company’s net profits equal the average total assets for the year. In other words, the company is generating one dollar of profit for every dollar invested in assets.
Since the sole purpose of assets’ is to generate revenues and produce profits, the Return on Asset Ratio (ROA) ratio shows how well the company can convert its assets into profits—whether funded by equity or debt.
Return on Equity Ratio (ROE)
The Return on Equity Ratio (ROE) reflects how much money is made based on the investors’ investment in the company, not the company’s investment in assets or something else. ROE measures the ability of a company to generate profits from its shareholder investments by showing how much profit is generated by each dollar of common stockholders’ equity.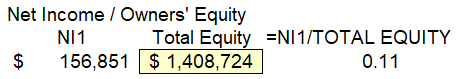 A ratio of 1 means that every dollar of equity generates one dollar of sales. A 1.8 ROE means that every dollar of equity earned $1.80 or 180% return to owners on their investment.
ROE is significant for potential investors who want to know how efficiently a company will use its money to generate net income. ROE also indicates how effectively management uses equity financing to fund operations and grow the company.
Return on Capital Employed (ROCE)
The Return on Capital Employed (ROCE) refers to the total assets of a company, less its current liabilities. ROCE is also viewed as stockholders’ equity, less long-term liabilities. Both equal the exact figure, which measures how efficiently a company generates profits from its capital employed by comparing operating profit to capital employed. A ratio of 1 means operating income equals the capital employed by that company to produce that income. I.e., the company is generating one dollar of profit for every dollar of capital employed. A 0.2 return indicates that for every dollar invested in capital employed, the company made 0.20 cents of profits.
ROCE is more useful than ROE in evaluating the longevity of a company. This is because ROCE shows how many dollars in profits are generated by each dollar of capital employed. ROCE also considers long-term financing in looking at asset performance—to confirm whether the assets are generating returns at a higher rate than what it costs to borrow funding to secure these assets. To put it simply, if a company borrows at 10% and can only achieve a return of 5%, they are losing money.
Your P&L Statement can also be used to calculate throughput ratios quickly.
A throughput ratio measures the rate at which a business generates money. It is also the best way to measure the productivity of a machine, procedure, process, or system over a unit period, such as output per hour, cash turnover, or the number of orders shipped. In the business management theory of constraints, throughput is the rate at which a system achieves its goal. Throughput can best be described as the rate at which a system generates its products or services per unit of time.
Throughput calculations allow managers to understand better how efficiently they are manufacturing goods or conducting services by establishing both their baseline and the maximum rate at which something can be processed. Good managers can quantify the gap between where they are and where they want to be, or could be, across their business. Below are the most beneficial throughput ratios used by successful business owners:
Cash Throughput Volume
Reflects the amount of every sale deposited in the bank that should be available to cover fixed expenses and create cash reserves after COGS has been paid. This is your actual cash starting number before any profit is realized.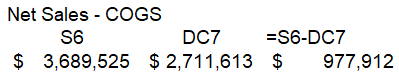 The Cash Throughput for Business A was $3.7 million in less $2.7 million out to generate $.98 million in Gross Profit. This number represents the volume of cash Business A generated over the year to cover their expenses. Put another way, it reflects how much money was left over after direct costs were subtracted from Net Sales.
Knowing how much incoming cash you can expect from sales is important, yet what’s even more important is knowing how much cash you’ll have remaining after paying the direct costs for those sales versus money that is simply passing through your bank account because there isn’t enough margin in it.
Simply put, having cash in the bank doesn’t mean that it’s yours to spend. Without a strong profit-driven number, it is impossible to have a strong Net Income number at the end of any accounting period. On a cash basis, this is the equivalent of “Gross Profit” on your P&L Statement.
Total Spend Productivity
This throughput view is used to determine how profitable a company is regarding operations and is a more accurate picture of a company’s success than Gross Sales. It’s also the best proxy for how much cash is likely to be held onto after every bill has been paid.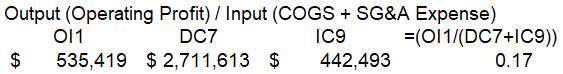 Knowing your Total Spend Productivity gives you a measure of how efficiently your business systems and processes convert inputs (all of your expenses) into useful outputs (profits). This number is calculated by dividing the ending output per period by the total incurred costs. Productivity is a critical determinant of cost efficiency and is often used to set performance standards. A 1.2 productivity ratio means that for every dollar of sales that passes through the bank, 20 cents will remain to cover interest and taxes and have profit left over to pay you a bonus or reinvest into the business.
SG&A Expense Productivity
Overhead expense significantly impacts profits since no dollar spent on G&A is directly attributable to a sell that contributed to gross profit earnings. To calculate G&A Expense Productivity, divide operating profit as the ending output for a period by the total G&A costs incurred for that input in that same period.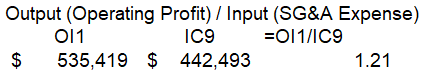 The smaller the ratio, the less impactful your overhead spend is on your operating profit. The higher the ratio, the more critical it is to manage these overhead expenses if you are to make a profit. A negative ratio indicates that this area is a drain on your ability to produce a profit. A ratio of -1 means that the company is generating a 1-dollar operating loss for every dollar invested in overhead expenses. A 2.0 ratio means that $2.00 in operating profit is generated for the equivalent of every $1.00 spent on SG&A.
Direct Labor Investment Productivity
Direct labor productivity is a critical determinant of cost efficiency and, ultimately, profitability for most businesses. This throughput view is used to determine how much your direct labor contributes to the operating profit of your company. This measure tells you how efficiently you are managing this talent pool overall to produce profits during a given period. 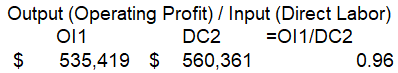 Your employees have been hired to generate revenues that produce profits. Your Direct Labor Investment Productivity measures how efficiently your direct labor investment converts wages, employment taxes, and assigned benefits into useful outputs (operating profit). It is calculated by dividing the ending output per period by the total costs incurred in that period. A ratio of 1 means that the company is generating 1 dollar of operating profit for every dollar invested in a direct laborer. A 0.6 ratio means that $0.60 in operating profit is generated for every $1.00 in direct labor compensation paid.
This throughput measure isn’t about any particular direct employee. It’s about measuring how productive your direct labor talent pool is with the higher the profit return you earn from your investment in the employees who get the work done to more profitable your business is likely to become.
Office Staff Investment Productivity
An effective office staff is key to your operation’s ability to make or lose money based on their ability to keep score and collect payment for the work of your direct labor. Often, direct labor productivity tanks when the office isn’t accurately paying them their wages. Office Staff Investment Productivity shows how efficiently you manage this “overhead” talent in producing profits during a given period. It’s an overall gauge of where you’re at, not a measure of any single office employee. Your direct labor productivity is impacted positively or negatively by your investment in office staff who support the processes you’ve set up to get the work done.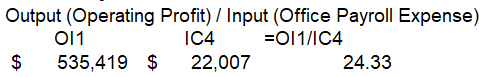 Office Staff Investment Productivity measures how efficiently your office staff can convert wages, employment taxes, and assigned benefits into operating profit contribution. This number is calculated by dividing the ending output per period by the total compensation paid. A ratio of 1 means that the company generates the equivalent of 1 dollar of operating profit for every dollar invested in Office Staff. A 2.3 ratio means that the equivalent of $2.30 in operating profit is generated for every $1.00 in office staff compensation paid.
Covering your cost calculations is business math not directly taught in business school.
Making money starts with accurately knowing your costs across your business. Another basic business truism is that money is “hard to earn and easy to lose.” The best way to guard your money with care is by knowing the actual costs of your business so that you can price your products and service to make money.
Basic business calculations are the starting point for achieving financial freedom. Use these formulas to take your understanding of the math of your business to a more meaningful level. Financial freedom is not something that happens randomly for the fortunate few; it’s something that you engineer by knowing the math behind your business costs. When you can do the math for any area of your business, you can change the results of the current equation by changing the inputs to that equation. Below are the best math formulas for confirming how much cost you need to cover from your Net Sales:
Cost To Do Business
Gross Sales of $1,000,000 and net income of $50,000 is the same as $1.00 – $0.05 = $0.95 is your cost to do business on every dollar collected. Put another way, you spent $950,000 chasing after the $50,000 you earned from the original million in gross sales. Every cent you don’t spend is a penny that drops straight to your bottom line. Below is what this profit calculation looks like for Business A: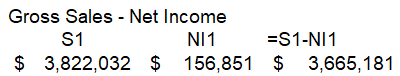 Your cost of doing business is the number that lies between your top-line Gross Sales and your bottom-line Net Income. You, and your business, win by continuously pushing yourself to more effectively manage the assets of your business as you simultaneously control the expenses flowing through your sales, operations, finance, and administration functions. Winning or losing in the game of business is ultimately measured by your ability to convert a dollar of sales into a profit.
Knowing your costs across your business, at both the gross profit and operating income levels, is the key to shrinking the gap between Gross Sales and Net Income.
Your financial statements and select financial ratios shed light on your field of play, so you’ll know your next move to higher profits with confidence.
Average Daily Cost To Do Business
Those who are best at staying on top of their cost of doing business know what their average cost per day is to keep their doors open. If your average cost per day is $2,400 and you take in $3,000, you’re $600 ahead. If your next day’s cost structure doesn’t change, and you only take in $1,700, you’re down $700 for the day and $100 for the two days because you took in less than you spent. Below is what this look like for Business A that averages five working days per week through the year.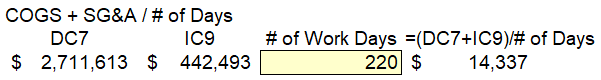 Your business wins through building on daily success. Your profit or loss is the cumulative result of your daily actions throughout any given period. You can only begin to control expenses when you know how much money is flowing through your sales, operations, finance, and administration functions daily.
If, at the end of the day, you have converted a higher share from a dollar of sales into a profit—then you can count that day as a win. If you spent more than you collected, you lost. You won’t start making a profit again until you earn back the profit through higher sales and lower costs.
Revenue per “All” Employees
It’s essential to look at revenue per employee—instead of profit per employee—because the revenue you generate is a direct result of your employees. If they aren’t doing their jobs, there is no revenue to collect and, therefore, no profit. Below is what this number is for Business A, which employs 50 people.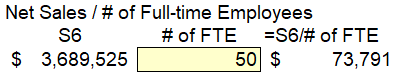 Now, consider how this value shifts if they let go of their less productive employees.
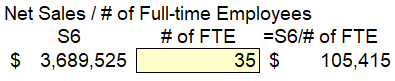 The people you hire to generate the revenues that produce profits have a cost. The only way your employees benefit you is when you can collect more in sales than the amount it costs to keep them on the payroll. And the more productive your total talent base, the higher your profit return.
A company earning $100,000 in sales per employee will struggle against a company earning $1,000,000 in sales per employee. This is because the more employees you have on your payroll, the higher the risk of costly mistakes, so you need to push this number up continuously.
Overhead Absorption Rate
To make a profit, you have to cover both your direct (variable) and in-direct (fixed) costs in the prices you set for your goods and services. Overhead absorption is the amount of indirect costs not directly traceable to an activity or product. These are considered a cost of doing business and must be paid through any sales dollars you collect.
Any money spent that isn’t covered through your product and service pricing models is an immediate loss to your business. An overhead absorption rate is calculated, most simply, by dividing total fixed costs by total variable costs. This is the overhead rate that should be added to all direct costs and considered when calculating the price you will charge for your products and services. Failure to include this figure in your pricing calculations and decisions robs you of profits. In our example, this is a minimum of 16 cents for every $1.00 of sales: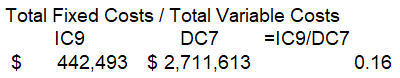 Put another way, if your average cost per day is $12,400 and you take in $15,000, you’re $2,600 ahead for that day. If your next day’s cost structure doesn’t change, and you only take in $7,400, you’re down $5,000 for the day and $2,400 for the two days because you took in less than you spent. This is why keeping your overhead low is one of the keys to making more money with less stress.
Breakeven Sales Point
The breakeven point represents the point-in-time at which a business, product, or project becomes financially profitable. This occurs when revenue equals the estimated total costs, such that loss ends and profit begins to accumulate on every dollar held onto during that accounting period. For most businesses this is a useless calculation as shown in Business A: I.e., they broke even at $1.7 million in sales, but this doesn’t matter unless they are able to flex their pricing to stimulate demand when sales are slow. Yes, a business with a breakeven point of $500,000 will begin to earn a dollar of profit when net sales reach $501,000. As long as their cost structure doesn’t change as sales increase, every dollar sold and collected above $500,000 represents business profit in theory, but in reality, it is something different when mistakes happen and money is wasted.
Knowing your Breakeven Sales Point makes the most sense for businesses with a high asset base required to generate sales. For businesses with low overhead and few assets to support, this number is relatively meaningless.
New Investment Validation Calculations is the best business profit calculation to use anytime you consider any new investment in your business.
Making money as a small business owner is difficult, particularly when fighting a never-ending fight of decisions needing to be made. Decisions that will either help you make money or lose it.
Small business owners unduly add to the stress of owning their own business when they waste hard-earned cash on investments that generate little to no return. The worst thing you can do for your business is to trade a dollar for four quarters or less. You avoid doing this by using core profit calculations and ratios to make smarter decisions in your business.
Given how easy it is to waste money in business, the following calculation easy to perform math that will tell you in a moment how much Net Sales will be required to recover a planned spend by each profit level for Business A planning a $125,000 new spend.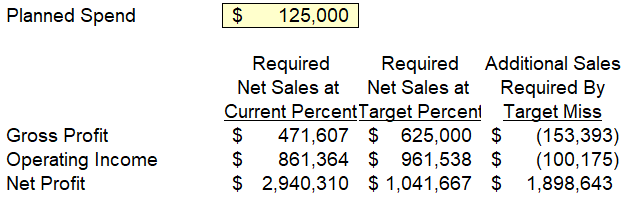 In our example, they will need to generate $1 million in Sales at their planned Net Income percent of Net Sales to earn back the $125,ooo investment. Within BusinessCPR™ Profit Math Calculations worksheet is this same setup tied to the previous and plan year values you enter. Use the shaded area to enter how much you plan to invest in your business. Based on the P&L Statement data you entered into business-cpr.com coupled with the profit targets you identified, you will see below how much you will have to earn back in Net Sales to cover your planned spend.
Would you like help making more money?
Click here to schedule an appointment with one of our certified BusinessCPR™ Business Scientists to discuss how better to apply the profit math of business to your business.
Want help making more money?
Click the link below to schedule an appointment with one of our certified BusinessCPR™ Business Scientists to discuss how better to apply the profit math of business to your business.
SCHEDULE APPOINTMENT