Synopsis
Every dollar of profit you earn comes from past actions that delivered results. If your business isn't generating the desired income, leading and lagging metrics can pinpoint areas where adjustments are needed. Leading metrics are particularly valuable because they help identify potential problems early on, allowing you to make timely improvements.
How to use leading and lagging metrics to confirm your decision quality and make more money.
Making more money is grounded in the business truism: you can’t control what you can’t manage, and you can’t manage what you can’t measure—anything you want to improve starts by first establishing your baseline measurement.
Once you know your baseline, you can set your improvement targets. After establishing your targets against their baseline, you know the gap size you need to close. With this information, you can now measure progress against your baseline to determine if what you are doing is producing better or worse than where you had planned to be.

Use leading and lagging metrics to identify where corrective action is needed if you aren’t making the kind of money you would like to.
You close the gap between where you start and where you want to end up through consistent action on B-CPR Step 3—Confirm the Quality of Your Profits. Every profit dollar you earn results from past actions that produced a profitable result. So the sooner you identify where corrective action is needed, the sooner you will see improvements in your current and future results.
Six components to follow in working with your financial statements and ratio analysis:
- Measures, indicators, and metrics are how you confirm your profit quality.
- Leading and lagging metrics need to work in tandem.
- A monthly review of your financial statements is better than no financial statement review.
- Financial ratios are another set of financial tools used by large businesses yet seldom by small businesses.
- The biggest drawback with financial statements is how they report what’s already happened, not what’s likely to happen.
- The right metrics matter because the right actions matter.
Measures, indicators, and metrics are how you confirm your profit quality.
Measures record a directly observable value or performance. All measures have a unit attached, such as an inch, a centimeter, a dollar, or a liter.
Indicators, in contrast, indirectly measure a value or predict an outcome, such as customer satisfaction and leading indicators of performance listed in the table below.
Metrics are standards of measurement by which efficiency, performance, progress, or quality of a plan, process, or product are assessed. Effective managers use the following two types of metrics to measure the performance of their employees, operations, and ultimately, the profits of their business:
|
Leading Metrics |
Lagging Metrics |
| Leading Indicators are inputs – they measure the activities that are necessary to achieve your goals. | Lagging Indicators are the outputs – they measure the actual results that confirm whether you hit or missed your goal. |
| These come first. They describe how to achieve your goals, serving as indicators of the likely results of your actions. These metrics are outcome predictors that are harder to measure but are easier to influence and improve upon directly. | They show the final score of your profit plan execution. These metrics summarize the outcome of an event. As a result, are easy to measure, but impossible to improve upon directly, or influence, in the near-to-short-term. |
| · Measures ACTION
· Key Performance Indicator (KPI) · Key Behavior Indicator (KBI) · Activity-based · Shorter periods—hours, days, and weeks · Shapes BEHAVIOR |
· Measures RESULTS
· Key Results Indicator (KRI)
· Financial-based · Longer periods—months and years · Shapes GOALS |
Leading and lagging metrics need to work in tandem.
You need to utilize both types of metrics to manage your business. Leading metrics are the best way to ensure that behaviors and actions are managed as they need to be. Lagging metrics confirm how your business is performing relative to your goals. They consider your financial results for revenue, costs, and profit measuring, and they indicate the effectiveness of these past activities throughout your company during any given period.
When you combine your profit plan targets with your financial statements, you create a reoccurring indicator, one that is likely to predict your year-end financial results. And as you approach the year’s end, your updated predictions will likely be more accurate.
It’s amazing how many business owners fail to consistently view their financial statements to gauge the health of their businesses. It’s even more amazing when these business owners operate without clear targets to gauge their month-to-month progress.
They are operating in the dark!
Those who do this are those who don’t understand why their bank statement balance and P&L statement have different numbers.
A monthly review of your financial statements will change your business for the better.
The number one difference between business owners stuck in the Survival Stage and those who own thriving businesses is that they are well-intentioned, it’s how they never review their P&L Statements each month. They’re so caught up in dealing with the day’s problems that they don’t take time to monitor, at a minimum, their monthly financial reports.
Small business owners remain small because they’re never sure exactly what to look at when reviewing their P&L Statement. In reality, all that is needed is a quick monthly review to help you identify precisely where you need to begin taking new actions if you want to realize better results in the following month.
Below are the primary financial results by sales, operations, and finance that are readily available from your P&L Statement and Balance Sheet reports:
SALES—Get Work
| Monthly Metrics | Metric Formula |
| Monthly Net Sales | Monthly Gross Sales – Refunds – Bad Debt = Net Sales |
| Year-to-Date Net Sales | Year-to-date Gross Sales – Refunds – Bad Debt = Net Sales |
| Year-over-Year Monthly Sales Percent Change | Current Months Sales – Previous Year Month Sales / Previous Years Month Sales = Year-over-Year Month Percent Change |
| Year-over-Year Year-to-Date (YTD) Sales Percent Change | Current YTD Sales – Previous YTD Sales / Previous YTD Sales = Year-over-Year YTD Percent Change |
| Monthly Actual as a Percent of Monthly Sales Goal | Actual sales divided by planned sales for the month |
| YTD Actual as a Percent of Total Sales Goal | Actual sales divided by planned sales year-to-date |
Operations—Do Work
| Monthly Metrics | Metric Formula |
| Gross Profit Percent Month-to-Date | Net Sales – COGS for the month divided by Net Sales |
| Gross Profit Percent Year-to-Date | Year-to-date Net Sales – YTD COGS divided by YTD Net Sales |
| Revenue per Direct Payroll | Net Sales divided by Direct Payroll Costs for the month |
| Cycle Time | Customer Authorization Date divided by the Payment Receipt Date |
| Average Order Value | Order Gross Sales divided by the number of orders received for that period |
| Merchandise Cost as Percent of Sales | Material Cost divided by Net Sales |
| Direct Labor Billable Rate | Total number of billable hours divided by total number of direct labor hours paid for the week |
| Direct Labor Overtime Ratio | Total direct labor overtime paid divided by the total direct labor regular hours paid |
| Percent of jobs closed ahead of contracted completion date | Total number of jobs completed early divided by the total number of jobs completed in that period |
| Equipment Availability Rate | Total number of days equipment is unavailable divided by the total pieces of equipment times 30 |
| Return on Asset Ratio | Net Income for the month divided by Total Assets |
FINANCE—Enable Work
| Monthly Metrics | Metric Formula |
| EBITDA for Month | Gross Profit – SG&A Expense for the Month |
| EBITDA Year-to-Date | Year-to-date Gross Profit – YTD SG&A Expense |
| A/R Current | Total A/R that is Current (less than 30-days) |
| A/R 1 to 30 Days Past Due | Total A/R that is 1 to 30 days past due |
| A/R 31 to 60 Days Past Due | Total A/R that is 31 to 60 days past due |
| A/R 61 to 90 Days Past Due | Total A/R that is 61 to 90 days past due |
| A/R > 90 Days Past Due | Total A/R that is greater than 90-days past due |
| Average Days Payable | Accounts Payable divided by COGS times 365 |
| Return on Capital Employed | Capital Employed = Total Assets – Current Liabilities; ROCE = Operating Income divided by Capital Employed |
| Change in Investment Fund | Current account balance less the previous months account balance |
| Gain on Asset Sales | Amount of Gain or Loss being reported in current month P&L Other Income |
Reviewing the above performance measures for less than an hour a month will confirm where you are making money and where you are losing it across your sales, operations, and finance functions.
Business owners who remain stuck in the Survival Stage never help their businesses through this simple analysis of their business results. They will learn things about their business by applying these straightforward equations to their financial statements. All that is needed is financial statements they can trust prepared on time to shape the decisions needing to be made for the months ahead.
Financial ratios are another set of financial tools used by large businesses yet seldom by small businesses.
Financial ratios are mathematical comparisons of financial statement accounts used to understand how well a business performs and where it needs to improve. A significant benefit of financial ratios is that they are agnostic relative to a company’s size or industry type.
Each ratio is a raw financial position and performance computation used to identify a company’s strengths and weaknesses. The five most common categories of financial ratio groupings include the following:
- Profitability Ratios compare income statement accounts and categories to show a company’s ability to generate profits from its operations by focusing on its return on investment in inventory and other assets.
These ratios judge how well a company can achieve profits by verifying how well it uses its resources and assets to generate profits.
- Efficiency Ratios measure how well companies utilize their assets to generate income. They are also called activity ratios. They analyze the time it takes a company to collect cash from its customers or the time it takes to convert inventory into cash—in other words, make sales.
These ratios go hand in hand with profitability ratios because company profits are derived from efficiently using company resources. Most often, when companies are efficient with their resources, they become profitable.
- Liquidity Ratios measure a company’s ability to meet its near-term financial obligations through liquid assets that can be quickly converted to cash and reported on the balance sheet as cash, short-term investments, current A/R, and inventory. They are the most widely used ratios, coming in at a close second to profitability ratios.
These ratios analyze a company’s ability to pay off its current liabilities as they become due and its long-term liabilities as they become current. Their results are especially important to creditors to measure a business’s ability to meet its short-term obligations.
- Solvency Ratios measure a company’s ability to sustain operations indefinitely by comparing debt levels with equity, assets, and earnings. Solvency ratios are also called leverage ratios. Financial leverage is the relationship between debt and equity on the right-hand side of a company’s balance sheet. Increasing leverage means increasing the proportion of debt to equity.
- Coverage Ratios are comparisons designed to measure a company’s ability to pay its liabilities by analyzing its ability to service its debt and other obligations. When shareholders own a majority of the assets, the company is said to be less leveraged. When creditors own most of the assets, the company is considered highly leveraged, resulting in a riskier and less sustainable capital structure.
Coverage ratios appear similar to liquidity and solvency ratios, but there is a distinct difference. These ratios measure how easily companies can afford to meet the interest payments associated with their debt.
A less standard set of ratios is Throughput Ratios, which measure how a business generates money. These ratios measure the productivity of a machine, procedure, process, or system over a unit period, such as output per hour, cash turnover, or the number of orders shipped.
In the business management theory of constraints, throughput is the rate at which a system achieves its goal. Throughput can best be described as the rate at which a system generates its products or services per unit of time. Throughput calculations allow managers to understand better how efficiently they are manufacturing goods or providing services by establishing both their baseline and the maximum rate at which something can be processed. Good managers can quantify the gap between where they are and where they want to be, or could be, across their business.
The opportunity exists in small businesses to use the power of financial ratios the way the wizards of wall street use them to determine whether a company is worth investing in or not. All you need to calculate any financial ratio is your P&L Statement, Balance Sheet, and the ratio formula.
The biggest drawback of financial statements is that they report what has already happened, not what is likely to happen.
Unfortunately, every financial statement is a lagging indicator of results, not a leading one. Fortunately, each accurate financial statement readily informs the quality of the decisions and actions you have already made.
Leading and lagging metrics working in tandem help you track the progress of your activities from start to finish to the final results. Think of it as a simple equation where “actions = results.” Start with the results you want, represented by your key lagging indicators, to make the equation work. Then work backward to identify the necessary actions, the leading indicators you will need to act on to realize your planned results.
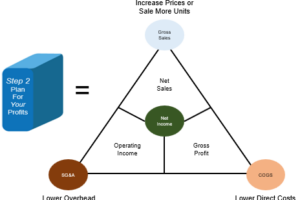
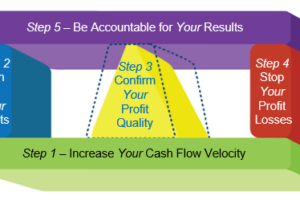
Step 2 in the BusinessCPR™ Management System establishes your revenue and profitability targets by month. Your efforts here define what success will look like for the year ahead and each month. Step 3 focuses on confirming the quality of your results. It allows you to check whether you need to adjust your actions’ quantity, quality, efficiency, and effectiveness in real-time. And it’s the best way to assist you in achieving the planned profit results in Step 2.
Failure to carry out Step 3—Confirm the Quality of Your Profits through leading and lagging metrics is the surest way to develop serious problems with cash, not just cash quality, but cash velocity. Simply put, the negative consequence of bypassing Step 3 will likely include trading a dollar for four quarters at best. Not an effective way to operate your business!
The right metrics matter because the right actions matter.
Every profit dollar earned results from past decisions and the actions triggered by those decisions. Some of those profit-contributing actions were planned and carried out deliberately. Others occurred by chance. Either way, “profits” equals “results” and “results” equals “action.”
Many companies with high-energy owners operate their businesses by observing the value, “bias for action, and passion for results.” This value reinforces the goal of using metrics to measure the results of the activities they are pursuing.
While the focus of the finance function will always be to track changes to the P&L and Balance Sheet statements, these items also represent an excellent source for metrics in every business, no matter its size. And yes, using these financial statement measures is far better than no measurement of performance results at all! The bottom line is that financial statements represent the scorecard for the results of your leading metrics (KPIs) whether or not you intentionally track them.
Using leading and lagging metrics is the best way to measure progress toward your goals. Quantifying current results against identified “critical success” activities is easy when you understand the formulas that calculate your different financial results.
Each miss to target results indicates where corrective action should be taken. The sooner you intervene, the more likely you will see results and realize your profit goal.
Want to see how metrics could work in your business?
If you want to learn how to use your financial statements better to assess your business performance, click here for a “free” sampling of relevant financial metrics and ratios from a BusinessCPR™ certified Business Scientist.
Within thirty-six hours of receiving the multi-year P&L Statement and Balance Sheet, you will receive your free sampling of financial metrics ratios by email, which you can start to use immediately.
Want to see how metrics work?
If you want to learn how you can better use your financial statements to assess your business performance, click the link below for a “free” sampling of relevant financial metrics and ratios for your business from a certified BusinessCPR™ Business Scientist.Within thirty-six hours of receipt of the multi-year P&L Statement and Balance Sheet, you will receive back by email your free sampling of financial metrics ratios you can start to use immediately.
FREE ASSESSMENT

