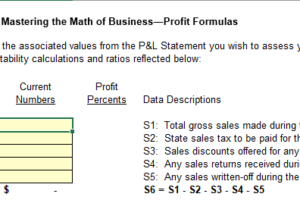
Synopsis
The best way to hold onto more of the cash flowing through your business lies in learning how to do the cash math of business. When you understand the mathematics of cash, you develop tighter control over your business. You are better positioned to use the numbers reported in your financial and bank statements to quickly calculate where you have cash issues and where you don’t. Those who apply the basic formulas of math to managing their business hold onto more of the cash flowing from their Net Sales.
Use the cash math of business to stop wasting cash, so you hold onto more money flowing into your business
There are many suggested approaches addressing the question of how to solve cashflow problems. The reality is that when you are struggling to meet payroll and have not paid yourself for a while, you don’t have time to try to understand any well-laid-out theory on how to solve cashflow problems. The immediate need is to quickly anchor yourself on the facts of your current situation through the cash math of business.
Fact-driven urgency is required because when you are out of cash, you are out of business. This is the number one law of business. No cash, no business. It doesn’t matter how good your financial reports are or whether your accountant has audited them; if you are out of cash, you have severe problems in all aspects of your life.

The primary reason business owners fail to consistently use their P&L Statements that report on their profitability with their bank statements that show them how cash has been deployed is that they don’t understand how business cash flow is calculated. Failing to calculate simple business cash flow ratios robs them of the opportunity to better manage the cash flowing through their business.
Learn the cash math of business to develop tighter control over your business. This is more than managing your business through your bank statement. The math of cash shows up in disciplined cash management practices that enable you to factually follow the money through your business. It shows you where you are making money and where you are losing money, so you know where to intervene to stop wasting it.
When you understand the flow of cash through your business, you immediately see what you need to start, change, and stop. Knowing what goes into calculating your business cash flow tells you faster than your financial statements where your business is in and out of control. Failing to apply the cash math of business makes it difficult to know what areas in your business cost you more money than they should.
Business decisions are always easier after you calculate your cost to do business
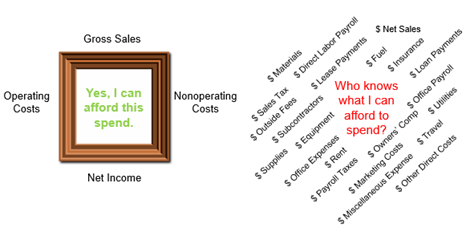
Failing to calculate your cost of doing business compromises your ability to put your money to the best use. Decisions become more difficult when you aren’t clear on how much you can afford spend, given your probable sales volume. It is impossible to be confident in taking on a new action that costs you money when you don’t have a frame around what you can afford to spend on a given day, week, month, or year.
BusinessCPR™ helps you see your business through the business cash flow calculations and ratios that enable you to confirm if you can afford to spend what you need to spend to realize your profit plan. The other benefit of knowing the cash math of business is that you will stress less about cash and work fewer hours to achieve the results you desire because you are using your transaction data to influence your decisions and actions so you make more money with less stress.
You will spend less time in and worry less about your business when you focus each day on those “critical few” actions that need to be accomplished. Use this website to see just how easy it is to do the cash flow math of business. Below are the 9 most commonly used math of cash formulas consistently used by money-making business owners who don’t mess around with their cash.
-
Cost To Do Business
Formula inputs are the Gross Sales and Net Income amounts from your P&L Statement. The “cost to do business” calculation is the following:
Gross Sales – Net Income = Cost To Do Business
Gross Sales of $1,000,000 and net income of $50,000 is the same as $1.00 – $0.05 = $0.95 out of every dollar of sales is this business cost to do business. Put another way, $950,000 was spent chasing after the $50,000 earned from the original million in gross sales. Profits exist where money drops straight to the bottom line because it wasn’t spent.
-
Average Daily, Weekly, Monthly Cost To Do Business
Formula inputs are the Gross Sales and Net Income amounts from your P&L Statement. Use these P&L inputs to calculate the following average costs to do bueinss:
(Gross Sales – Net Income) / 52 = Average Weekly Cost To Do Business
(Gross Sales – Net Income) / 12 = Average Monthly Cost To Do Business
(Gross Sales – Net Income) / 220 = Average Daily Cost To Do Business
If your average cost per day is $2,400 and you take in $3,000, you’re $600 ahead. If your next day’s cost structure doesn’t change, and you only take in $1,700, you’re down $700 for the day and $100 for the two days because you took in less than you spent.
Your profit or loss is the cumulative result of your daily actions throughout any given period. You can only begin to control expenses when you know how much money is flowing through your sales, operations, finance, and administration functions through the day, week, and month. When your inflows are greater than your outflows, your business wins. If you spent more than you collected, you lost, and you won’t start making a profit again until you earn back the profit lost through higher sales and lower costs.
Your average daily, weekly, and monthly cost to do business values required to keep your doors open helps you quickly see when your business spend is out of control per day, week, or month. Use these values to know to recognize when you are spending more than you can afford so you can reduce your spend without delay while you work to increase sales.
-
Cash Throughput Volume
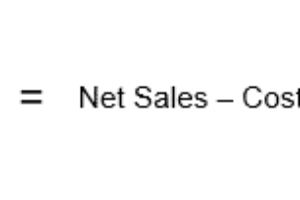
Formula inputs are Net Sales and Direct Costs (COGS) from your P&L Statement. The “cash throughput volume” calculation is the following:
Net Sales – Direct Costs = Cash Throughput Volume
The result of the Cash Throughput Volume calculation tells you the amount after sale have been deposited in the bank that should be available to cover fixed expenses and create cash reserves after COGS has been paid. This is your actual cash starting number before any profit is realized.
Cash Throughput Volume reflects how much money is left over after direct costs are subtracted from Net Sales. This number represents the volume of cash your business is generating to cover your expenses, over a day, week, month and year. Yes, Net Sales represents your operating cash inflow, yet it is what’s left over after you subtract your direct costs that represents the working cash you have available to cover the fixed and nonoperating costs incurred. The money remaining here is your starting point for building cash reserves.
Knowing how much incoming cash you can expect from sales is important, yet what’s even more important is knowing how much cash you have to work with after paying the direct costs for those sales vs. money that is simply passing through your bank account because there isn’t enough margin in it.
Simply put, having cash in the bank doesn’t mean that it’s yours to spend. Without a strong presence of Gross Profit in your sales bank deposits, it is impossible to have a strong Net Income number at the end of any accounting period.
-
Cash Ratio
Formula inputs are your Cash, Cash Equivalents, and Current Liabilities from your Balance Sheet. The “cash ratio” calculation is the following:
(Cash + Cash Equivalents) / Current Liabilities = Cash Ratio
A Cash Ratio of 1 means that the company has the same cash and equivalents as its current debt. Uses this cash calculation to see if your company maintains adequate cash balances to pay off all of your current debts owed to your creditors.
The Cash Ratio shows the company’s readiness to repay all current liabilities within three months by measuring a company’s ability to pay off its current liabilities with only cash, cash equivalents, or other assets that can be converted into cash within 90-days, as a percentage of current liabilities.
It is different from the Working Capital Ratio because it does not reflect any Accounts Receivable. The Cash Ratio confirms if a business is maintaining adequate cash balances to pay off all of its current debts as they come due, given that inventory could take months or years to sell and that receivables could take weeks to collect.
A healthy Cash Ratio is important to creditors because it confirms an adequate cash position to repay them. The Cash Ratio has also been proven to reduce business owner stress because they know they have the cash to pay their obligations without having to chase after past due receivables from their slow payers or dodge the collection calls caming at them when they slow pay those they owe.
-
Cash Reserve Months
Formula input is your current checking and savings bank balance. This is your available cash. Do not include any Balance Sheet values in this calculation. Next project out your monthly average by the week of cash inflows and cash outflows use a table like the following:
|
Week 1 |
Week 2 | Week 3 | Week 4 |
Monthly Average |
|
| Cash Inflow | $ – | ||||
| Cash Outflow | $ – | ||||
| Ending Cash | $ – | $ – | $ – | $ – | $ – |
The “cash reserve” calculation is the following:
Monthly Average Ending Cash / Current Available Cash = Months of Cash Reserve
A Cash Reserve of less than 1 means you don’t have any cash reserve. Your cash is flowing out as fast as it’s flowing in with no cushion to carry you through a downturn in sales. This is the number one cause of small business failure. The lack of cash reserves to carry a business through a sales decline is what runs them out of cash then out of business. A cash reserve number greater than 1 represents the number of months of cash reserve you have available to cover your business expense.
Calculating the number of months your cash reserve will last is the best way to gauge the urgency you must act with when it comes to increasing sales and reducing costs. Know this number to know what you can and can’t afford to spend.
-
Accounts Receivable Days (ARD)
Formula inputs are your Net Accounts Receivable from your Balance Sheet and Net Sales amount from your P&L Statement. The “accounts receivable days” calculation is the following:
Accounts Receivable / Net Sales = Accounts Receivable (A/R) Days
A/R Days of 45 establishes that the average days it takes to collect payment from your customers is 45-days. Customers taking longer to pay may represent bad debt, whereas customers who pay on time are more valuable and should be retained.
Accounts Receivable Days (ARD) is the average number of days a company takes to collect payments on goods sold. Also called “days sales” in receivables or “debtor days,” it represents the length of time it takes to clear all Accounts Receivable or how long it takes to receive the money for goods sold. This is a useful number for determining how efficiently the company collects whatever short-term payments it is owed.
The importance of calculating your average number of days to collect the money owed to you by your customers is proportionate to the amount of credit sales you make. If you own a business with more sales on account than cash and credit card sales where the receipt of payment is almost immediate then you need to know the value of this formula if you are to have any success projecting your cash inflows for the weeks and month ahead.
-
Days Payable Outstanding
Formula inputs are your Accounts Payable from your Balance Sheet and the Direct Costs and Direct Labor amounts from your P&L Statement. The “days payable outstanding” calculation is the following:
Accounts Payable / (COGS – Direct Labor) = Days Payable Outstanding
A/P Days of 35 establishes that the average days it takes to pay your vendors is 35-days from the invoice date. Calculating the average number of days it takes to pay the money you owe to your suppliers is both a measure of how well you manage your cash and a leading indicator of how likely you are to stay in good standing with your vendors and suppliers.
Days Payable Outstanding measures the average number of days it takes the business to make payments on purchased goods. The length of time it takes to clear all outstanding Accounts Payable is a useful number for determining how efficiently the company is clearing its short-term account obligations.
-
Working Capital or Current Ratio
Formula inputs are total Current Assets and Current Liabilities from your Balance Sheet. The “working capital ratio” is calculated as follows:
Current Assets / Current Liability = Working Capital Ratio
If current liabilities exceed current assets, the current ratio will be less than one (< 1) indicating difficulties in paying short-term obligations. A current ratio of 4 would mean that the company has four times more current assets than current liabilities.
The Working Capital Ratio is mainly used to gauge the company’s ability to pay back its liabilities with its existing assets over the next 12 months. This ratio compares a firm’s current assets (cash, marketable securities, inventory, accounts receivable) to its current liabilities (short-term debt and accounts payable). Every business has a limited amount of time to raise the funds needed to pay for these common liabilities.
The higher the current ratio, the greater the “cushion” to cover its obligations. If the current ratio is too high, then the company may not be efficiently using its current assets. In contrast, a low current ratio is usually the result of poor collections and accounts receivable processing. It is very unfavorable to have a negative working capital ratio.
This ratio also sheds light on the overall debt burden of the company. If a company is weighted down with current debt, its cash flow will suffer. When its current assets exceed current liabilities, the business should have enough available capital to run its day-to-day operations.
Use the Working Capital Ratio to know how well-positioned your business is to run day-to-day operations versus being weighted down with debt.
-
Debt Ratio
Formula inputs are total Liabilities and Assets from your Balance Sheet. The “debt ratio” is calculated as follows:
Total Liability / Total Assets = Debt Ratio
A ratio of 1 means the company would have to sell off all assets to pay off its liabilities. A ratio of 0.5 means that the company has twice as many assets as liabilities. This means creditors own half of the company’s assets, and the shareholders own the remainder.
The Debt Ratio measures a company’s total liabilities as a percentage of total assets, showing the company’s ability to pay off its liabilities with its assets. More simply, this ratio shows how many assets the company must sell to pay off all of its liabilities and is a measure of the financial leverage of the company
Use the Debt Ratio to see how well your company is positioned to pay off its liabilities with its assets. It is also a measure of the value of your assets compared to what’s owed by the business. The more valuable your assets the more your business is worth.
Business peace of mind comes when you know your probable cash position for the next four weeks.
Making money starts with accurately knowing your costs across your business. Another basic business truism is that money is “hard to earn and easy to lose.” The best way to not waste your money is to know how your money flows in and out of your business. Know this so that cash outflows never exceed cash inflows.
Disciplined cash management is the starting point for achieving financial freedom. Use the formulas above to increase your understanding of your business cash position. Financial freedom is not something that happens randomly for the fortunate few; it’s something that you engineer by projecting your cash position for at least the next four weeks.
Knowing when cash is flowing into your business gives you the ability to manage your cash outflows. When you don’t know your cash inflow, you compromise your ability to make the best decisions for your business. Below is a business cash flow template you can use today to project your cash position for the next four weeks.
How to know if you are a business winner or not?
You and your business win by continuously pushing yourself to manage the assets of your business to generate sales as you simultaneously control the expenses flowing through your sales, operations, finance, and administration functions. Winning or losing in the game of business is measured by your ability to convert a dollar of sales into a profit.
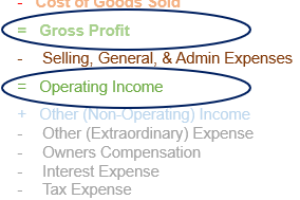
Knowing your costs across your business, at both the Gross Profit and Operating Income profit levels, is the key to shrinking the gap between Gross Sales and Net Income.
Your financial statements and select finance ratios shed light on your field of play, so you’ll know your next move to higher profits with confidence.
Would you like help learning the math of cash so you can hold onto more of it?
Click here to learn how best to set up an easy-to-use cash management system for your business from a certified BusinessCPR™ Cash Management expert so you can hold onto more of the cash flowing through your business.
Want help setting up a cash management system?
Click the link below to talk with a certified BusinessCPR™ Cash Management expert to learn how best to set up an easy-to-use cash management system for your business so you can hold onto more of the cash flowing through your business.
SCHEDULE APPOINTMENT