Every business on every transaction either earns a profit or they don’t. The cumulative results of each sales transaction by month, quarter, or year are reported on the P&L Statement representing Gross Sales. Subtract the direct, indirect, and nonoperating costs from Net Sales, and you get the Net Income or Net Profit for that period.
If a business struggles to earn profits, the Profitability Ratios are simple calculations to quickly assess where the business is losing money generating Net Sales.
Overview
Business profitability is critical to the principle of business solvency and in determining the probability of a business to remain a “going concern.” The only way your money works harder for you than you do for it is to generate returns on your use of cash. Every dollar you spend in your business ahead of earning a sale is an investment in the business.
Generate more sales than you spend, and you earn a profit. The higher your profits, the higher your returns from the money you spent. This is what calculating your Return on Investment Ratio does for you. It helps you know if the returns on the money you invest to generate sales are making you money or not.
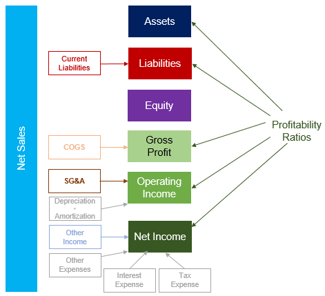
Profitability Ratios compare P&L Statement categories to show a company’s ability to generate profits from its operations by calculating its return on its asset investment. Profitability Ratios closely relate to Efficiency Ratios, which, too, show how well a company uses its assets to generate profits. The most common profitability ratios are the following:
- Gross Margin
- Product Contribution Margin
- Operating Margin
- Net Income Margin
- Return on Assets
- Return on Capital Employed
- Return on Equity
- Return on Investment
- DuPont Formula
The above ratios are used to judge how well a company uses its resources and assets to generate profits from operations.