You either know what’s happening across your business week-to-week and month-to-month, or you don’t. If you have the processes that ensure your weekly business transactions are accurately recorded, you have what you need to implement a scoreboard to make better decisions.
Without a scoreboard, you will spend more on COGS, SG&A, and other expenses than you planned for or ever intended, resulting in lower profits and less cash on reserve in the bank.
Overview
An effective metrics measurement system provides the following benefits:
- Linkage of sales, operational activities, and trends with financial performance.
- Ability to anticipate changes in business conditions before they “bite” you without warning.
- Better informed decision-making leading to continuously improving results.
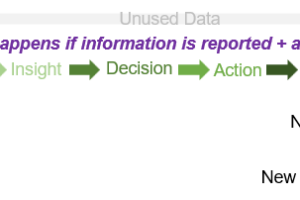
If you choose not to implement a metrics management system, you choose to surrender control over your business. You’re operating your business blindly via the “hope” method, “hoping” your daily activities across your business produce the results you want to see. The problem is “hope” can never be counted on to deliver planned results.
Once you have decided to measure and monitor your business results, the next decision is how you want to display your results. Scoreboards offer a broad way to track key result indicators (KRIs) that measure the overall progress of a business through the year. Scorecards provide a quick and concise way to measure key performance indicators (KPIs) that indicate how well core areas of a business are working to achieve their targets.
What is a Scorecard?
Scorecards offer a snapshot of current performance compared to goals for key business areas. They help those accountable for each area see gaps between current performance and the goal so they can be corrected before they negatively impact planned business results.
Scorecards are most commonly used to track KPIs, as they focus on both the current status of the metric being tracked and the target value. They monitor KPI results to identify where problems must be resolved without delay and where successes must be acknowledged. Scorecards are generally weekly measures, updated for reporting at the weekly management team meeting.
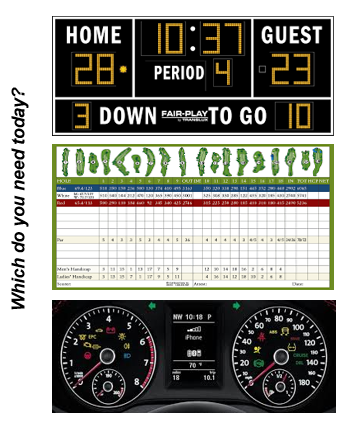
Whether you have an automated business intelligence system for populating your scorecards or accountable managers who populate their scorecards themselves, the reported results still have to be reviewed and interpreted to see where management needs to intervene. To appreciate the difference, consider how golfers must fill in their results on each hole onto their golf scorecard to get their total score for the round. In contrast, bowlers today get their score recorded automatically after each frame.
What is a Scoreboard?
Scoreboards represent a central hub for multiple reports that provide easy access to various datasets simultaneously. Unlike scorecards, scoreboards are used to assess monthly results. Information is reported once the bank statements for the month have been reconciled with the recorded accounting transactions.
As opposed to progress reporting, scoreboards report the results of the actions taken that month, comparing them to target values. Scoreboards are used to provide a foundation for better decision-making and more efficient month-to-month management of teams, resources, and expenses. More importantly, scoreboards help management view their historical and planned results against current results.
Your profit plan and financial statements by month are the required inputs for populating a monthly scoreboard. Examples of scoreboards are everywhere people gather in a stadium or arena to watch a game played. Sporting even scoreboards reflect the key results of a game in progress, so the fans better appreciate what’s happening in the field of play during the game. Business employees need the same type of visual of how the business is scoring month-to-month and through the year.
What is a Dashboard?
Dashboards are automated hubs from your business intelligence system that hold multiple reports pulled from automated access to various datasets. They are used as a monitoring tool in real time. Data is automatically updated, giving management the ability to track their operational performance in real time. Data available in dashboards are used to provide a foundation for better decision-making and more efficient day-to-day management of teams, resources, and expenses. Large businesses commonly use them to report functional KPIs monthly KRIs. Business dashboards are likened to vehicle dashboards that relay vital information to the driver about the vehicle’s speed, fuel level, and temperature while in operation.
The challenge for small businesses is that dashboards only work if you have an automated system for pulling the required data being recorded across the business into the dashboard. Large businesses with integrated financial, sales, and operational information systems can do this. They are limited to only their financial statements to gauge how the business is performing. They will use marketing dashboards to monitor advertising campaigns and operation dashboards to track operations centrally.
Small businesses focused on making more money use a scoreboard for the company-wide KRI reporting and scorecards for sales, operations, and finance KPI reporting. The scoreboard is monthly tracking of critical results to help those in the business gauge how the business is doing year-over-year and to plan. The scorecards are used weekly to confirm that required actions are occurring as measured by KPI results.
Small businesses are advised to start with a scoreboard of the key results they target to hit each month. Scoreboards give you a clear view of how well the business has performed so that needed adjustments can be readily seen. Knowing the gap between the actual and the plan helps management isolate what worked well and what fell short of the plan. When this is known, management can make informed decisions on what needs to continue, be started, and stop for better results in the months ahead.
As the management team becomes comfortable working with scoreboard results, it is time to implement scorecards for sales, operations, and finance. Knowing what KPIs impact your KRIs is how you structure each scorecard. Scorecards give you a concise view of specific areas critical to the business’s success. They are used to determine how well each area’s KPIs are being met, how they are keeping up with their daily tasks, to appreciate how close or far they are from their weekly goals. This is useful when attempting to identify areas for improvement or ways to make specific tasks more efficient.
Using both the scoreboard and scorecards will give your management team a clearer picture of the health of the business and your progress toward reaching your sales, operational, finance, and strategic goals.